
Mana’s Q1 2026 Market Review and Outlook
Asset Class Performance
Market performance in Q1 2026 was defined by significant dispersion and a notable reversal of recent trends. U.S. large-cap stocks, which had dominated returns in prior years, fell 4.2% in the quarter, while infrastructure (+8.1%), global REITs (+1.0%), and U.S. small cap (+0.9%) were among the few equity categories to finish positive. That rotation was also visible in the one-year figures: emerging market equity led all asset classes at +29.6%, followed closely by infrastructure (+25.8%) and non-U.S. equity (+23.0%), all of which outpaced U.S. large cap's +17.7% over the same period. Fixed income was broadly flat to slightly negative in Q1, while cash held its ground. The chart below summarizes returns across major asset classes for both Q1 2026 and the trailing one year.
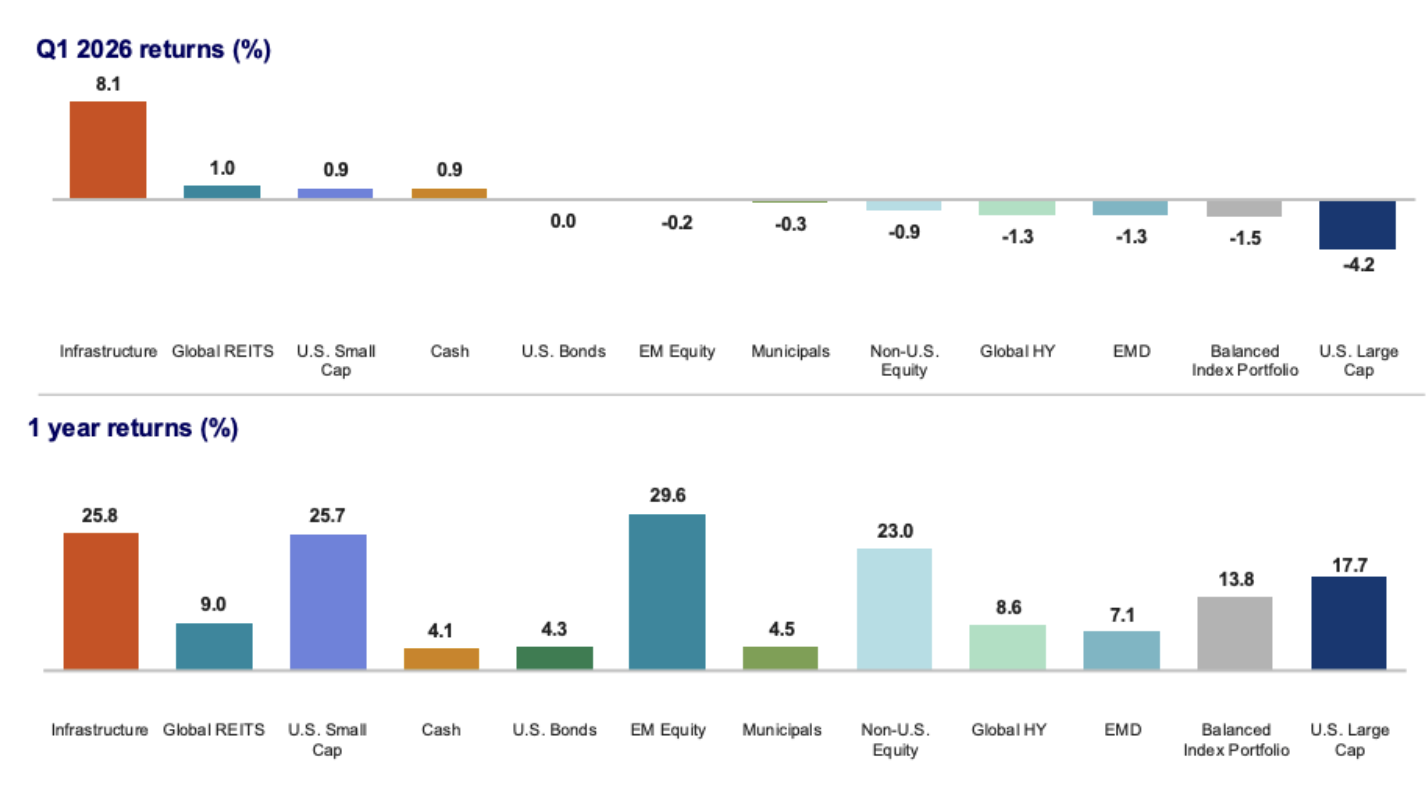
Source: Russell Investments Q4 2025 Economic & Market Review. U.S. Small Cap: Russell 2000® Index; U.S. Large Cap: Russell 1000® Index; Non-U.S.: MSCI World ex-USA Net index; Infrastructure: S&P Global Infrastructure Index; Global High Yield: Bloomberg Global High Yield Index; Global REITs: FTSE EPRA/NAREIT Developed Index; Municipals: Bloomberg Municipal 1-15 Yr. Blend Index, Cash: Bloomberg 1-3 Yr US Treasury Index; EM Equity: MSCI Emerging Markets Index; U.S. Bonds: Bloomberg U.S. Aggregate Bond Index; Balanced Index: 3% U.S. Small Cap,36% U.S. Large Cap,13% Non-U.S., 2% Infrastructure, 4% Global High Yield, 2% Global REITs, 2% Cash, 4% EM Equity, 34% U.S. Bonds. Index returns represent past performance, are not a guarantee of future performance, and are not indicative of any specific investment. Indexes are unmanaged and cannot be invested in directly.
Investment Commentary & Outlook
The S&P 500 started the year strong, but our clients weren’t reassured. They kept asking about AI, about jobs, and about what we’re actually building toward. In March, the conflict with Iran changed the picture entirely. This letter walks through what happened, why we think the long view still matters, and how to think about your own decisions in moments like these.
Oil, War, and a Sudden Shift
January and February were relatively steady. The S&P 500 was near all-time highs, corporate earnings were strong, and inflation had stabilized around 2.4%.
In early March, the United States and Israel conducted military strikes on Iran. The conflict disrupted shipping through the Strait of Hormuz, a narrow waterway in the Persian Gulf through which roughly 20% of the world’s oil supply travels. When the Strait closes or slows, global oil markets feel it immediately. Oil moved from roughly $55 per barrel in December to over $100 by quarter-end. A ceasefire was reached late in the quarter, and oil prices fell from their peak, though they have not returned to pre-conflict levels.
The impact on markets was sharp. The S&P 500 fell about 9% from its January high and ended Q1 down roughly 5%. Energy stocks surged, up 38% for the year through March. Technology, financials, and consumer-facing companies fell hardest. A portfolio holding only US large-cap growth stocks experienced this quarter very differently from one spread across sectors, geographies, and asset classes.
The Economy
The underlying economy is slow, but not broken. GDP grew at a 0.7% annualized rate in Q4 2025. Job growth has slowed, and February payrolls were actually negative, though the unemployment rate held at 4.4%. The reason this is not as alarming as it sounds is that the workforce is shrinking. Baby Boomers are retiring at a rate of roughly 11,000 per day, and net immigration has declined sharply. There are fewer workers available, which means weak job prints do not signal deterioration the way they once did.
Inflation will likely move higher before it comes back down. The energy spike from the Iran conflict could push headline inflation toward 3.5% by early summer, though much depends on whether oil prices stabilize. The Federal Reserve held rates steady in March.
One important piece of context: the United States is now a net oil exporter. Higher oil prices are not purely a drag on the US economy, the way they were in prior decades. What households lose at the pump, domestic energy producers gain. That said, the pain is real and unevenly distributed. Lower and middle-income households spend a much larger share of their income on energy, and that stress is showing up in consumer credit data.
Markets, Diversification, and Sentiment
A 9% pullback in the middle of a geopolitical conflict is uncomfortable. Historically, it’s also unremarkable. Since 1980, the average intra-year decline for the S&P 500 has been 14.2%. The market has finished the year with positive returns in 35 of those 46 years. Volatility and permanent damage are not the same thing.
This quarter illustrated something we think about every time we build a portfolio. The Magnificent 7, the handful of large technology names that accounted for 83% of S&P 500 returns in 2025, fell 11% in Q1. Investors concentrated in US large-cap growth felt this quarter acutely. Portfolios spread across sectors, geographies, and asset classes fared better.
If you’ve read any of our past investment letters, it should be no surprise that Mana believes in the value of diversification. Valuations outside the US remain meaningfully more attractive than they have been for some time. The Eurozone trades at roughly 14x forward earnings, emerging markets at 13x, compared to 20x for the S&P 500. International stocks narrowly outperformed US stocks in Q1 2026, continuing a trend that began in 2025.
Another data point worth holding onto: the University of Michigan Consumer Sentiment Index fell to 53 in March, well below its long-run average of 77. Historically, sentiment readings that low have preceded average 12-month S&P 500 returns of over 24%. We are not forecasting that outcome. It is a reminder that periods of fear and periods of opportunity tend to overlap.
On Artificial Intelligence
In late February, a scenario piece circulated widely in financial markets. Written as a memo from June 2028, it imagined a world where AI-driven white-collar job displacement triggers a consumer spending collapse, private credit defaults, and eventually a mortgage crisis. The authors were clear that it was a thought exercise. It was vivid enough to briefly move markets and generate a lot of questions from clients.
The scenario is thoughtfully constructed, and the underlying question is worth taking seriously. The same demographic forces making it plausible also make the worst-case path less likely. The workforce is already shrinking from Boomer retirements and the immigration decline. The economy may need AI to fill the gaps left by retiring workers, not fear it as a cause of mass displacement. Productivity improvements have historically lowered costs, expanded output, and supported real incomes over time, even when the transition disrupted specific workers and industries.
We will note separately that the rapid growth of private credit over the past decade warrants attention, particularly its concentration in technology-related lending. It is something we are watching carefully.
How to Think About a Quarter Like This
The hardest part of investing is rarely the math. It’s what happens between your ears when the headlines are loud and the screens are red. Markets give you regular opportunities to make the wrong decision at the worst possible time, and the cost of those decisions tends to dwarf almost everything else in a financial plan.
A few patterns we see often, especially among clients with significant equity compensation and RSU planning needs, concentrated stock positions, or a recent liquidity event:
The urge to “do something.” When the news is dramatic, doing nothing feels irresponsible. It usually isn’t. A well-built portfolio is designed to absorb quarters like this without your intervention. Acting on a headline almost always means selling something that has already fallen and buying something that has already risen. The cost is paid now; the regret arrives later.
Confusing volatility with loss. A 9% drawdown is not a 9% loss unless you sell. Paper movements are part of the price of long-term returns, not a deviation from them. Investors who internalize this distinction tend to make far better decisions than investors who don’t.
Anchoring to the peak. It is natural to feel like a portfolio that touched $X in January is now “down” if it sits below that number in March. But the peak was a single day. Your real reference point is the long arc of your plan, not the highest tick on a chart.
Treating recent winners as the new baseline. When a small group of stocks delivers most of the market’s return, it is tempting to assume they always will. Concentration looks like genius until it doesn’t. The investors who rode the Magnificent 7 up in 2025 also rode them down in Q1.
Making permanent decisions based on temporary feelings. Geopolitical conflicts, election cycles, and macroeconomic shocks generate intense emotions. Rewriting your long-term financial plan during one of those moments is among the costliest mistakes an otherwise thoughtful investor can make.
What Proactive Planning Actually Looks Like
The clients who navigate quarters like this best are not the ones with the strongest stomachs. They are the ones whose plans were built before the headlines arrived. Proactive financial life planning means the hard questions get asked when markets are calm, not when they are falling.
A few things that look different inside a thoughtful planning process:
• Your allocation matches your actual goals and timeline, not a generic risk score from a questionnaire. If your situation has changed materially in the past few years, your portfolio should reflect that.
• Liquidity is mapped to upcoming needs, including planned home purchases, tuition, business investments, and care for aging parents. You should not need to sell equities at a loss to fund a known expense.
• Equity compensation and RSU planning is integrated with the rest of the plan. Concentrated stock positions are addressed deliberately rather than reactively, with a tax-aware framework for diversifying over time.
• For business owners, liquidity event and business exit planning begins years before the transaction. The decisions made before a sale often matter more than the ones made after.
• Cash reserves are sized intentionally, so a quarter like this never forces a sale.
• Tax planning is continuous rather than seasonal, so down markets can be used to harvest losses and rebalance more efficiently.
• The plan accounts for the full picture of a sandwich-generation life, including parent care, education funding, and your own retirement, rather than optimizing one piece at the expense of the others.
When this groundwork is in place, a quarter like Q1 becomes a question of patience rather than a question of survival.
Questions Worth Asking Yourself
If the past several months left you uneasy, the most useful thing you can do is not check your portfolio more often. It is to sit with a few honest questions.
• If markets fell another 20% from here, would my plan still work?
• Am I taking more risk than I actually need to take to reach my goals?
• Do I know what my portfolio is supposed to do over the next five years, or am I evaluating it on what it does over the next five days?
• Is my concentration in any single stock, sector, or asset class a deliberate choice or a leftover from past decisions?
• Do I have a plan for the next major life transition I can see coming, or am I assuming I’ll figure it out when I get there?
These are the conversations that matter. They are also the conversations clients tend to push off until something shakes them. A market shock is one of the more useful prompts to have them.
A Final Note
The market selloff in March was a reminder that risk is not just a number on a page. For some of you, it prompted a genuine question: do I actually need to be taking this much risk to reach my goals?
That is a worthwhile question. Strong recent performance can quietly build a cushion that makes a more conservative path possible without compromising what you are trying to accomplish. For others, the answer goes the other way: a long horizon and disciplined behavior may mean you can afford to stay the course through volatility you would not have thought you could tolerate.
We do not believe in timing the market. What we do believe is that your portfolio should match what you actually need to accomplish, not carry more risk than necessary, and not less than your goals require.
If you had concerns during March, or if you are wondering whether your current path still fits where you are in life, that is exactly the conversation we are here for. As a fee-only fiduciary financial advisor offering virtual financial planning nationwide, our work is to make sure the plan fits the life, not the other way around.
Thank you for reading. We are grateful for the trust our clients place in us, and for the broader community of readers who have followed our writing along the way.
Follow our Instagram for personal finance tips and inspiration.
Stephanie Bucko and Cristina Livadary are fee-only financial planners based in Los Angeles, California. Stephanie is the Chief Investment Officer and Cristina is the Chief Executive Officer at Mana Financial Life Design (FLD). Mana FLD provides comprehensive financial planning and investment management services to help clients grow and protect their wealth throughout life’s journey. Mana FLD specializes in advising ambitious professionals who seek financial knowledge and want to implement creative budgeting, savings, proactive planning and powerful investment strategies. As fee-only fiduciaries and independent financial advisors, Stephanie and Cristina never receive commission of any kind. Stephanie and Cristina are legally bound by their certifications to provide unbiased and trustworthy financial advice.