
Mana’s Q4 2023 Economic and Market Review
Asset Class Performance
Stock markets rallied into year end across all regions, with US indices up 12-14% and international up 10% in the fourth quarter. This brought the S&P 500 and MSCI World Ex-USA US Stock Indices within 5% of their all-time highs. Ten of the eleven S&P Sectors posted positive total returns in Q4 of 2023. The Real Estate sector led the way with an 18.8% total return, followed by Technology (17.7%), Financial (13.9%) and Industrial (13.1%). Only Energy was in the red in Q4, finishing down -6.4%. US Growth was the top total returner in 2023, with the S&P 500 coming in second. Commodities was the only asset class that failed to post a positive total return in 2023. US Bond prices rallied as a result of shifts in the yield curve, 2-30 year interest rates fell by 70-90 basis points as the market priced in an expectation that the Fed would reverse course.

Extensive research has shown that, if you have a diversified portfolio, a whopping 88% of your experience (the volatility you encounter and the returns you earn) can be traced back to your asset allocation. - Vanguard.
Investment Commentary + Outlook
Year In Review
If you read the headlines of 2023, you would have read a series of arguments about the impending U.S. recession, which could have prevented even the most long-term minded investors from investing:
In the first quarter of 2023, the Fed raised interest rates by 0.50%, yields on treasury bonds began to rise rapidly. March and April brought the demise of Silicon Valley Bank, Silvergate Bank and Signature Bank within five days of each other. In May, Nvidia hit the $1 trillion valuation mark and the Fed raised interest rates by another 0.25%. In June and July, the S&P moved out of bear market territory with a 20% advance from its October 2022 low. In August, Fitch downgraded United States long term debt from AAA to AA+. In October, the average 30-year fixed rate mortgage hit 8% and a war erupted between Israel and Gaza.
While any one of these headline grabbing events could cause disruption in financial markets, last year was a constructive year in both the stock and bond markets in the United States.
Stock Market
As of December 2023, SPY’s Top 10 Holdings comprise 30.85% of the S&P 500-tracking ETF, while QQQ’s Top 10 Holdings make up almost half of the Nasdaq-indexed ETF. The “Magnificent Seven'', sometimes referred to as the “S&P 7”, is comprised of Apple (AAPL), Amazon.com (AMZN), Alphabet (GOOG, GOOGL), Meta Platforms (META), Microsoft (MSFT), NVIDIA (NVDA), and Tesla (TSLA). The Magnificent Seven was up a staggering 75.1% as a collective on a market-cap weighted basis. Meanwhile, the remaining “S&P 493” finished only 10.4% higher in 2023, and was actually negative at various times on a YTD basis. As a result of these large gains, these companies now represent 30% of the S&P 500 Index, which is a market-cap weighted index. This means that companies are weighted in the index relative to their overall size (market cap).
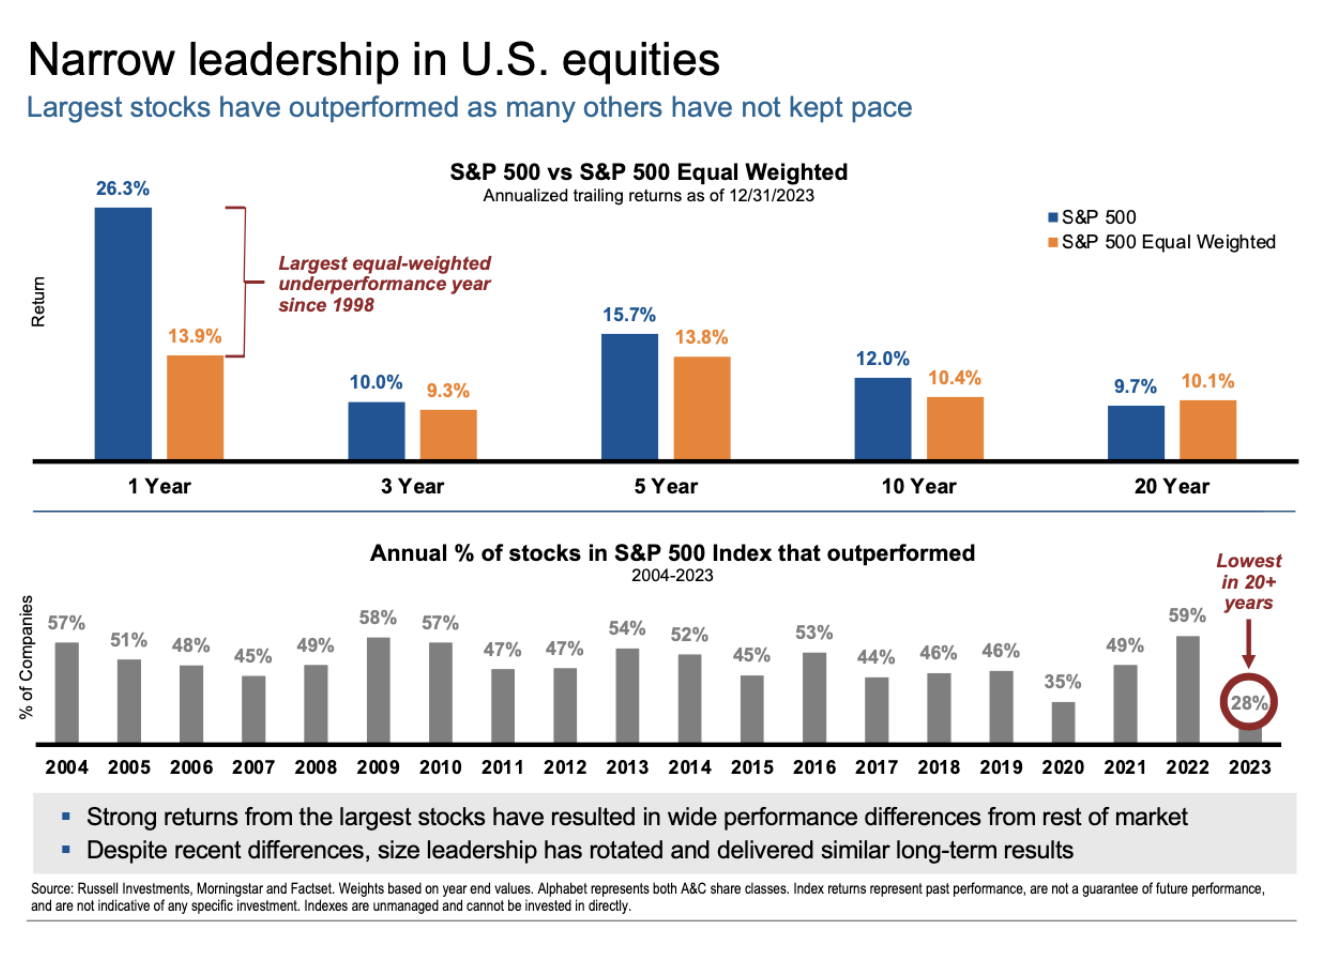
The substantial gains from the biggest stocks have led to significant performance variations with the rest of the market. Only 28% of individual stocks outperformed the average S&P 500 return, the lowest in a 20 year period. Similarly, if you had purchased equal weights of the S&P 500 versus the market-cap weighting, your 1-year return would have been 13.9% versus 26.3%. This is the largest difference witnessed in the market since 1998. The below chart shows a comparison of the last year versus typical annualized returns of the S&P 500 vs. the S&P 500 equal weighted index. 2023 sticks out as extremely abnormal from the 3 year, 5 year, 10 year, and 20 year trend.

.Comparing the US market to international markets shows a similar picture. Non-US stock valuations relative to their US stock peers are near 20 year lows. The average price to earnings ratio for international stocks is 16.4% lower than their US peers on average, but today’s discount is over 30%.
Emerging markets stock markets have lagged in recent years compared to developed markets. While we hold emerging markets to help diversify US exposure, the opportunity set has expanded, acting independently of changes set by US currency rates. Bloomberg and HSBC Global Research reported that Southeast Asia has overtaken the US as China’s largest export market. Furthermore, the yuan surpassed the dollar as China’s most used cross-border legal tender this year, and the renminbi use by foreign central banks has almost doubled.
Bond Market
Being an investor in the bond market in 2021, 2022, and even early 2023 was challenging. Bonds lost money 6 months in a row from May through October, the first time this has ever occurred. As interest rates rapidly rose, bond prices fell. Longer duration bonds were hurt the most, which is in part what led to the challenges experienced by Silicon Valley Bank and others in early 2023.

Source: BlackRock, January Student of the Market. Morningstar as of 12/31/23. U.S. bonds represented by the IA SBBI US Gov IT Index from 1/1/26 to 1/3/89 and the Bloomberg U.S. Agg Bond TR Index from 1/3/89 to 12/31/23. Past performance does not guarantee or indicate future results. Index performance is for illustrative purposes only. You cannot invest directly in the index.
Federal Reserve Chairman Powell had a shift in tone during the November Fed meeting, which resulted in a shift in performance in the bond market. During November and December, bonds bounced back, with the Bloomberg Barclays Aggregate Bond Index up 8.5%. This was the 7th best two-month period since 1926.
How to allocate extra cash?
At the end of 2023, interest rates dropped as a reaction to the Fed Chairman’s shift in tone regarding their path on interest rates. It’s clear that we’ve come a long way since the Fed engaged in hiking rates - inflation has fallen from its June 2022 levels of 9.1% to nearly 3%, wage growth has slowed but is exceeding inflation, unemployment has had 24 consecutive months of below 4%. The Fed has not taken any action to cut the Federal Funds Rate, but it is certainly within the realm of expectations given the trend of the current economic conditions. With the Target Fed Funds rate at 5.25%-5.5%, cash in high yield savings accounts or CDs is earning a significant yield. To play it safe, should you keep funds in cash?
Consider your after-tax real return.
Interest received from CDs and money market funds is taxed as ordinary income. After considering taxes and inflations, the return on a 5% CD may result in a reduced purchasing power. The chart on the right compares CDs to Municipal Bonds, measured by the Bloomberg Municipal Bond Index.

Source: Barclays and Russell Investments. Municipal Bonds: Bloomberg Municipal Bond Index. Certificates of deposit (CDs) offer a fixed rate of return, and the interest and principal on CDs will generally be insured by the FDIC up to $250,000. Top Federal Income Tax Rate* and Taxable Equivalent Yield: Based on maximum tax rate of 40.8% for Married Filing Jointly, including 3.8% Net Investment Income Tax.
Diversification works, even though it never feels good
In a world where performance is compared to the S&P 500, it can often appear counterintuitive to invest broadly across borders and asset classes - even for the seasoned investor. Nobel prize laureate Harry Markowitz famously said “Diversification is the only free lunch” in investing. New data from BlackRock and Morningstar shows us just how a globally diversified portfolio stacked up against the S&P 500 for the past twenty years.

Of particular importance in this chart above are the feelings associated with each time period. Diversification only appeared to “work” (read: beat the S&P) in the period between 2003 and 2007. Over the 20 year period, diversification not only worked; we’d argue that it prevented the worst kind of behavior: capitulating and going to cash at precisely the wrong time. After twenty years, the diversified portfolio and the S&P ended up with approximately the same return with a lot less stomach-turning volatility.
Follow our Instagram for personal finance tips and inspiration.
Stephanie Bucko and Cristina Livadary are fee-only financial planners based in Los Angeles, California. Stephanie is the Chief Investment Officer and Cristina is the Chief Executive Officer at Mana Financial Life Design (FLD). Mana FLD provides comprehensive financial planning and investment management services to help clients grow and protect their wealth throughout life’s journey. Mana FLD specializes in advising ambitious professionals who seek financial knowledge and want to implement creative budgeting, savings, proactive planning and powerful investment strategies. As fee-only fiduciaries and independent financial advisors, Stephanie and Cristina never receive commission of any kind. Stephanie and Cristina are legally bound by their certifications to provide unbiased and trustworthy financial advice.