
Q1 2023 Economic and Market Commentary + Outlook
Asset Class Performance
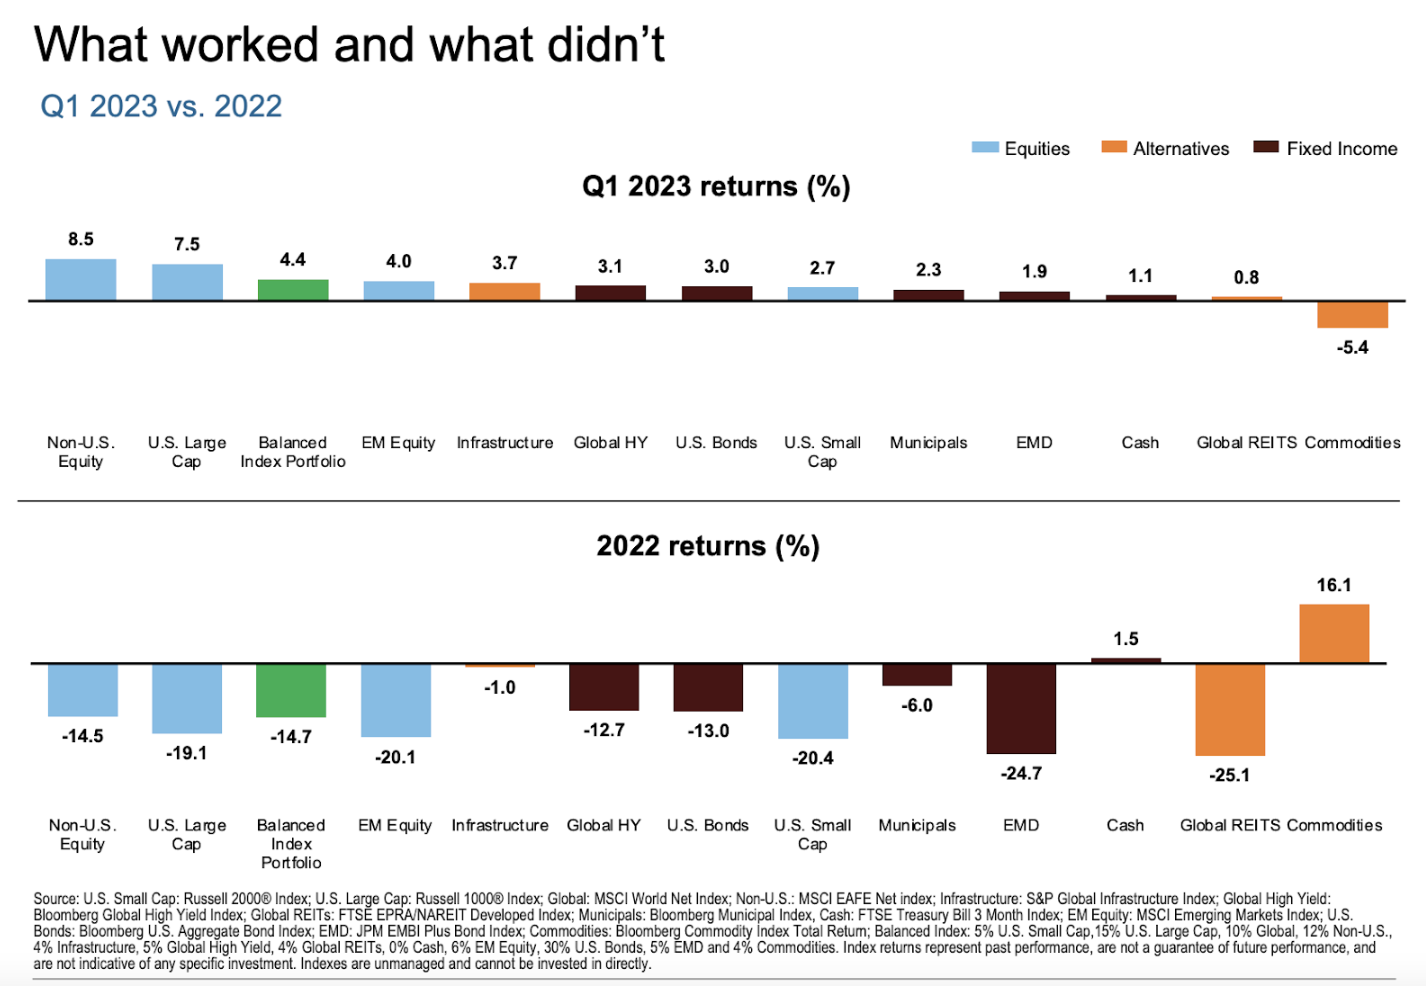
2023 started off strong with positive performance from all major asset classes outside of commodities. A weaker dollar supported growth of non-US equities, which YTD through March were up 8.5%. Despite a volatile February, US stocks were up 7.5% on average through Q1, with mega cap growth stocks leading the way. The Nasdaq Composite Index was up 17%. Bonds across all sectors performed well as expectations that the Fed will halt or reverse its rate hiking cycle.
Extensive research has shown that, if you have a diversified portfolio, a whopping 88% of your experience (the volatility you encounter and the returns you earn) can be traced back to your asset allocation. - Vanguard.
Investment Commentary + Outlook
Sector Divergence in the US
Three key trends drove sector performance in the start of 2023. First, the banking crisis triggered major losses in the banking sector, particularly in regional banks. Second, the expectations of the Fed reversed course; the market now expects the Fed will cut rates in the coming months, versus continuing to increase rates to control inflation. Third, a weaker US dollar and tightening lending standards by struggling banks provides headwinds for smaller companies. The result: outperformance of mega cap growth stocks, and underperformance of small cap and value stocks.

Does this trend continue? Bloomberg writes: that tech stocks in the S&P 500 are trading at almost 25 times prospective earnings, and to justify this multiple, Bloomberg Intelligence shows that the Fed would need to cut rates by at least 3%. While we think it’s important to have exposure to this market, maintaining a diversified approach enables an investor to participate without taking the downside risk. Remember in 2022, these same stocks were down 35%.
Data from The Capital Group shows that every decline of 15% or more in the S&P 500 from 1929 through 2020 has been followed by a recovery, with the average return in the first year after each of these declines being 55%!
Global Stock Outperformance
After a strong run since the start of 2021, the US dollar has declined in back-to-back quarters. From history, we see that international markets tend to underperform the US when the dollar is strengthening, but outperform when it weakens.
According to the capital markets team at JP Morgan, the stars do seem to be aligning for international stocks to take the baton from the US. over the next decade in terms of market leadership. Some of the metrics they cite are cheaper equity valuations, cheaper currencies, and a combination of cyclical and structural investment themes that can help boost long-term returns.
Even though international investing may seem ‘foreign’ to some, we thought this list of international companies, many of which are brands we’re very familiar with in the U.S., shows that international investing shouldn’t incite so much fear and doubt.

The Case for Duration
Below is a chart of short term treasury bonds vs. long term treasury bonds in 2022.
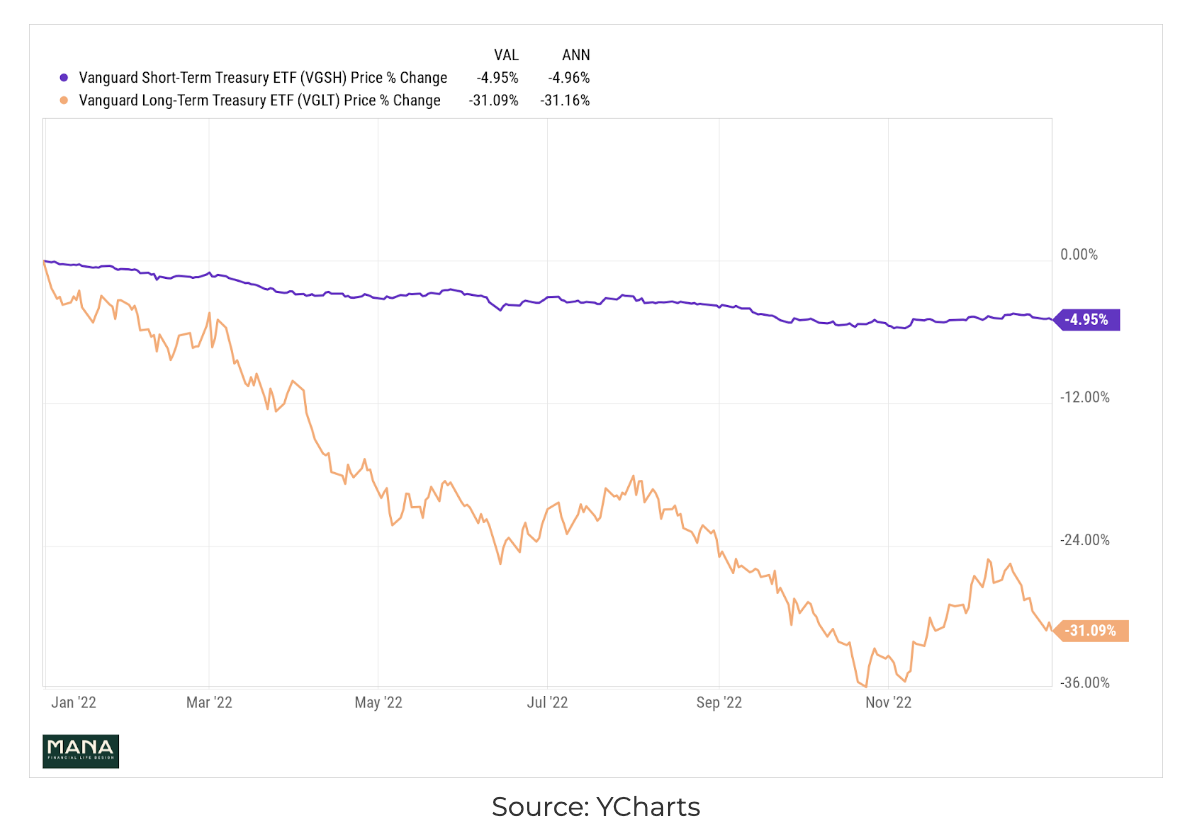
The banking crisis was caused by a number of factors which we discussed in great detail in our Bank Crises blog, but buying long-term treasury bonds was the largest driver of losses in bank portfolios. While we don’t know the exact bonds purchased by the failed banks, we want to provide an example of what happened (and why we have avoided these investments). Let’s say you bought a 30-year treasury bond yielding 1.25% in May 2020. Your intent was to hold this until maturity. If you decided to buy a 30-year treasury bond in February 2023, this same bond would yield 3.625%. This is a difference of 2.375%, meaning that you are now giving up 2.375% each year over the remaining 27 years of the bond. Today, the bond that you bought in 2020 is priced at $58. This price discount of $42 to par value (or the amount you get back when the bond matures, $100), is what the market is willing to pay to receive 1.25% interest.
The bank crisis triggered a number of changes in the market environment:
Bank balance sheets were put at the forefront of investor attention. The purpose of the Fed increasing interest rates is to tighten monetary conditions. The banking crisis itself tightened monetary conditions, and any further increases to interest rates can exacerbate the banking crisis.
It caused the US Treasury to put a backstop to banks holding treasury bonds. Now, if a bank needs money for a depositor, they can borrow from the Fed versus needing sell their portfolio of treasury bonds at a huge loss. This limits the amount of supply flooding the market, and thus interest rates shouldn’t have a rapid rise. (Supply up > price down > rates up).
It shifted market expectations from a Federal Reserve that will continue increasing interest rates to expecting the Fed will cut interest rates beginning the middle of this year.
Looking forward: Is now a good time to invest?

It is hard to escape the recessionary fears being heralded across the media. Although a recession (defined as two consecutive negative quarters of GDP growth) may be in our economy’s near term future, it is important to distinguish the market from the economy. As you can see in the chart provided by Russell Investments, data going back to 1948 show that market bottoms tend to happen before the economy has experienced its sharpest point of decline. Even more interesting is that the period between the market bottom and the GDP bottom has offered investors with an average return of 16%.
The past three years have felt anything but ‘normal’. For those who have been serious investors in the past decade, it can be unnerving to watch your portfolio fluctuate with the news. To provide some context, we thought it might be useful to see the S&P 500 performance going back to 1980. The most important thing to note here: In the past 43 years, the S&P 500 has experienced an average drop of 14.3% intra-year. Despite this number, the S&P 500 posted positive returns 74% of the time. Stay invested, stay disciplined, and stay focused on the long term job description your portfolio plays in your life.

Follow our Instagram for personal finance tips and inspiration.
Stephanie Bucko and Cristina Livadary are fee-only financial planners based in Los Angeles, California. Stephanie is the Chief Investment Officer and Cristina is the Chief Executive Officer at Mana Financial Life Design (FLD). Mana FLD provides comprehensive financial planning and investment management services to help clients grow and protect their wealth throughout life’s journey. Mana FLD specializes in advising ambitious professionals who seek financial knowledge and want to implement creative budgeting, savings, proactive planning and powerful investment strategies. As fee-only fiduciaries and independent financial advisors, Stephanie and Cristina never receive commission of any kind. Stephanie and Cristina are legally bound by their certifications to provide unbiased and trustworthy financial advice.