
Mana’s Q2 2022 Market Recap
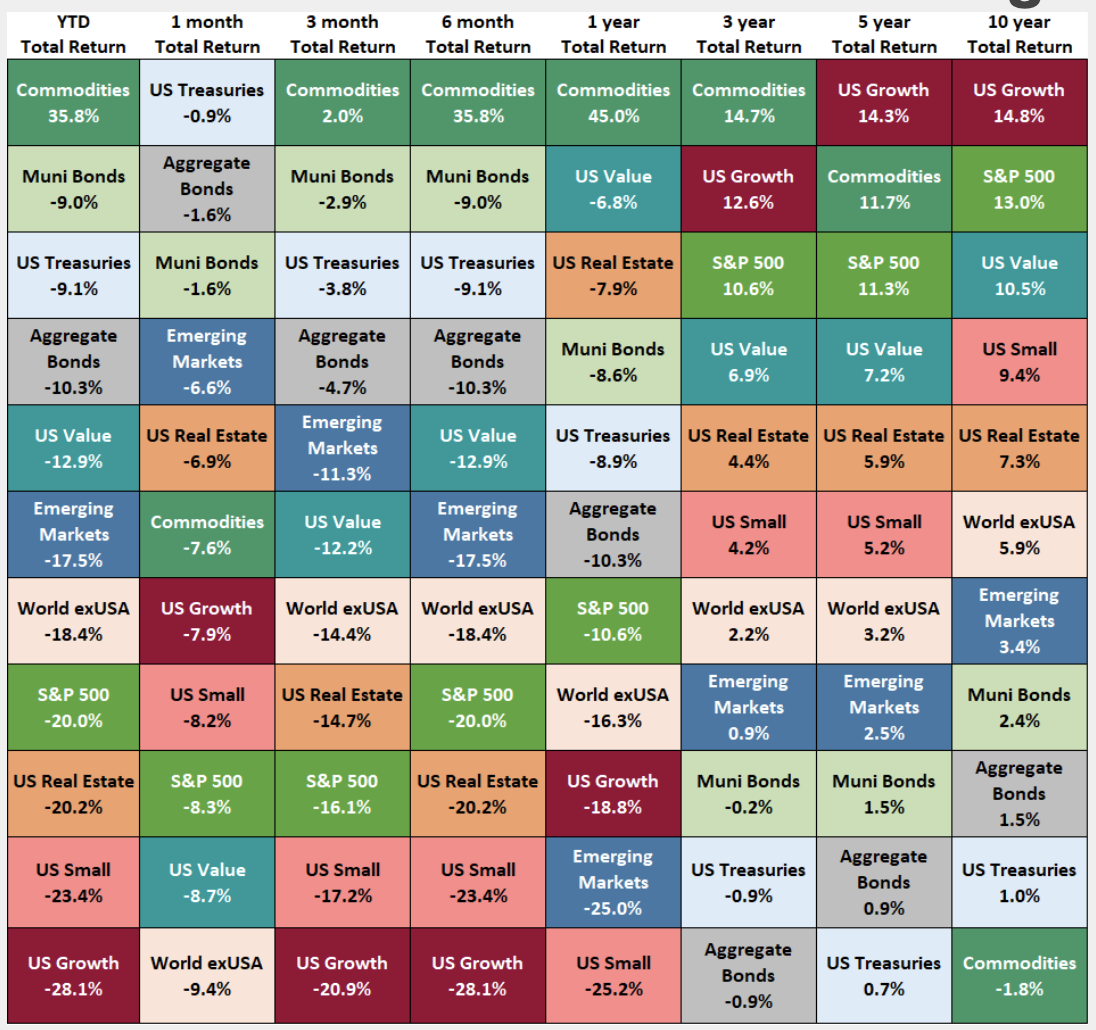
Asset Class Performance
US Stocks fell further in Q2 after a similarly red first quarter of 2022. The tech-heavy Nasdaq Composite was hurt the worst with a -22.28% decline in the second quarter. The international picture was much the same, with the MSCI World Ex USA index falling by -14.44% and Emerging Markets -11.34% lower. Not a single S&P sector posted a positive return over the course of Q2, each one was in the red. The Defensive Sectors did hold up best, with Consumer Staples returning -4.19%. After an exceptionally strong Q1, Energy also sank lower, but only by -5.45%. The Technology, Communication Services, and Consumer Discretionary sectors all fell by around 20% or more. Commodities once again performed best, returning 2.0% in Q2 and now 35.8% higher year-to-date in 2022. Emerging Markets continue to lead equity asset classes, but still fell -6.6% in June alone. This visual shows historical quarterly asset class performance for the last 15 quarters.
Extensive research has shown that, if you have a diversified portfolio, a whopping 88% of your experience (the volatility you encounter and the returns you earn) can be traced back to your asset allocation. - Vanguard.
Disclaimer: Past performance is not a guarantee of future results. Indices are not available for direct investment. Index performance does not reflect the expenses associated with the management of an actual portfolio. Market segment (index representation) as follows: US Real Estate (Dow Jones US Real Estate Index Total Return), US Growth Stocks (Russell 1000 Growth Total Return), Commodities (S&P GSCI Total Return), US Small Cap (Russell 2000 Total Return), S&P 500 (S&P 500 Total Return), US Value Stocks (Russell 1000 Value Total Return), World ex USA (MSCI World Ex USA Total Return), Emerging Markets (MSCI Emerging Markets Total Return), Aggregate Bonds (Barclays US Aggregate Total Return), Muni Bonds (Barclays Municipal Bond Total Return), US Treasuries (Barclays US Treasury Total Return). All data provided by YCharts.
Commentary + Outlook
The first half of 2022 was a turbulent time for just about every asset class.
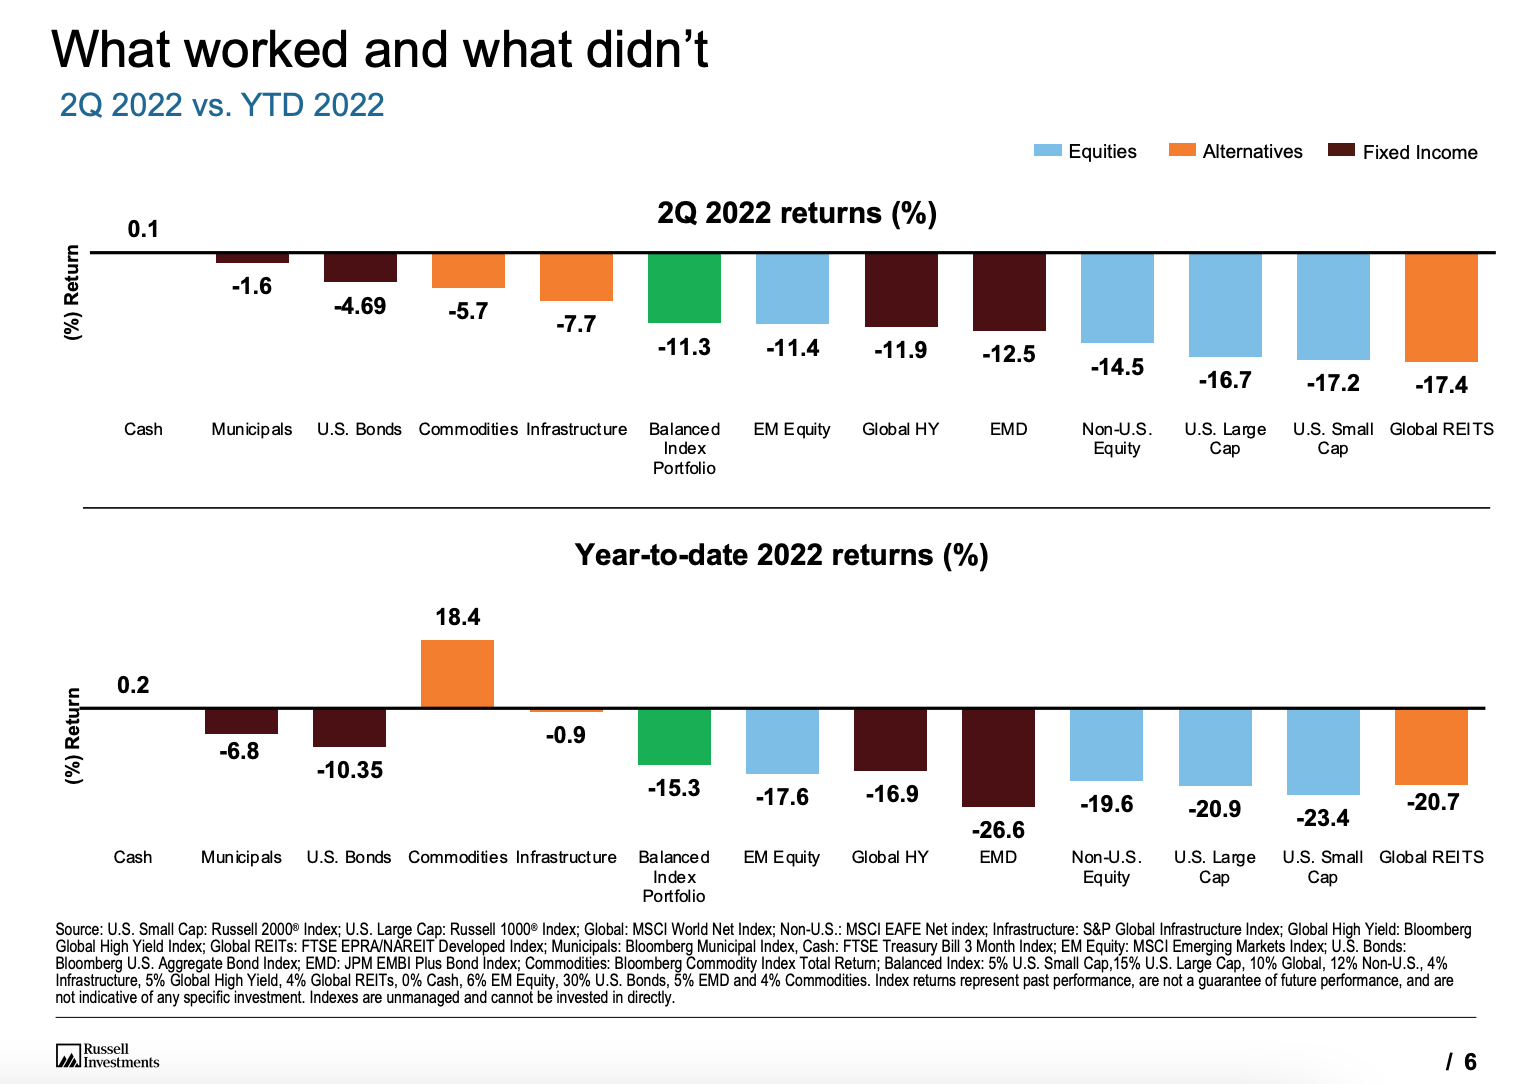
As this chart from Russell Investment shows, the second quarter continued to bring downward pressure to already beaten up asset classes. The only asset class that did well in the first half of 2022 was commodities - driven mostly by the price of oil.
As we look forward to the second half of this year, we at Mana are constructive about both the stock and the bond markets, especially for long term investors.
Equity valuations are more attractive than they were at the beginning of 2022. For example, the forward price-to-earnings ratio (a current stock's price over its "predicted" earnings per share) for the S&P 500 at the beginning of 2022 was 21.8. By the end of June 2022 it had fallen to 16.4, which is in the range of the 15-year average for the S&P 500. On the more extreme end, emerging markets started this year with a forward price-to-earnings ratio of 12 (also the 15 year average); they have since fallen below the 15 year average to 10.7, indicating that they are very much ‘on sale’.
Bonds are beginning to look more attractive with rising interest rates. However, in the process of interest rates rising, their prices can be negatively impacted. The below chart shows year to date total returns of three treasury bond ETFs. As you can see, iShares 20+ Year Treasury Bond ETF has lost -20% YTD.
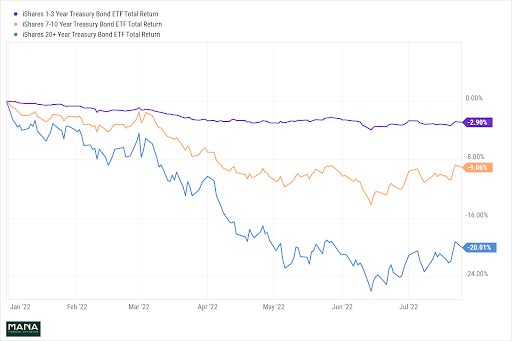
When an investor adds bonds to a portfolio, they should provide diversification to stocks, income for the portfolio, and/or improve the risk versus return profile. We started the year at a 1.94% yield on 20-year treasuries, and currently the yield is 3.5%. However, if interest rates rise by 1% - a relatively high probability event - prices on long term bonds could fall as much as another 20%. As a result, investors who have stayed invested in shorter term bonds have been hurt the least. The 2 year treasury rate is 3.0% and 5 year treasury rate is 3.2%, but in a similar stress test, we would expect drawdowns of 2% and 5%, respectively.
As we move into the second half of 2022, we are optimistic about stock market performance with sentiment at recessionary lows (be greedy when others are fearful), and the opportunity set in the bond market is improving. However, given the risks around inflation, and rising interest rates, further steps to diversify a portfolio are worth exploring.
Alternative Asset Classes
As we’ve transitioned from a bull market to a market where it’s harder to make money, we’ve leaned on the expertise Stephanie built in her previous career performing due diligence on hedge fund managers.
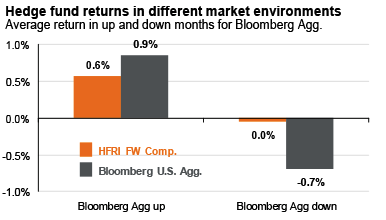
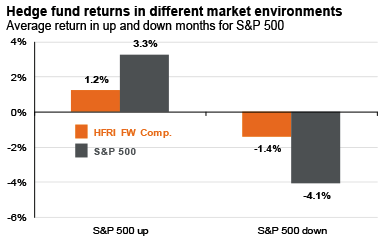
Hedge funds have historically provided differentiated streams of returns in a portfolio, helping increase diversification and lower overall risk in the portfolio. The chart to the right side of the page compares the returns on the HFRI fund-weighted composite index (the widely accepted broad hedge fund index) to returns on the S&P 500 in up and down markets for equities over the past 15 years. The bottom chart shows the returns from the HFRI index as well as the Barclays U.S. Agg. (representing the broad bond market) over the past 15 years. The bottom line of this display is that while manager selection is crucial, in general, hedge funds have provided investors with a lower volatility approach to equities, as well as fixed income-like returns without the same interest rate risk. This can help diminish overall portfolio volatility, and keep investors on track to accomplish their long-term goals.
Time and Diversification Work
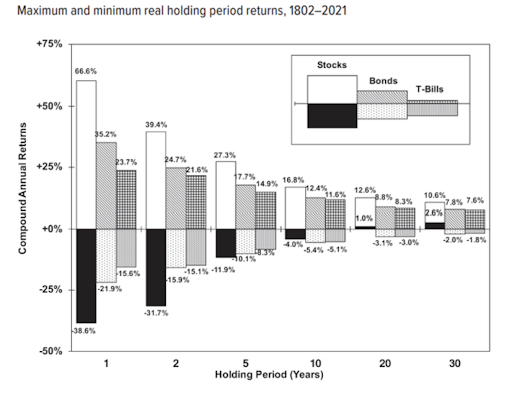
As investor Ben Carlson wrote earlier this month, “One of the hardest parts about investing is the fact that it’s impossible to predict the future but you have to set some baseline expectations about the future for the purposes of planning…History tells us the longer you invest in the stock market, the greater your odds of success when it comes to beating safer assets.”
Carlson recommends thinking through the historical return profile of stocks, bonds and cash to help you determine how to plan for time horizons ranging from short-term to intermediate-term to long-term and allocate your portfolio accordingly. This chart, created by Jeremy Schwartz and Jeremy Siegel shows that the shorter your time frame, the greater the variability you experience in returns in everything, especially in the stock market. The longer you have to invest, the lower volatility there is.
Both time and diversification favor the investor. The below chart from JP Morgan shows the powerful effects of portfolio diversification. The top chart breaks out performance of a 60% stock and 40% bond portfolio and the S&P 500 by decile of the past 20 years. On the stock market’s worst days, the 60/40 portfolio lessens the impact of the losses, highlighting that diversification is your best friend on the worst days.
The bottom chart shows 20-year annualized returns by asset class, as well as how an “average investor” would have fared. The average investor asset allocation return is based on an analysis by Dalbar, which utilizes the net of aggregate mutual fund sales, redemptions and exchanges each month as a measure of investor behavior.

The first half of 2022 has been a relatively painful ride, especially for those who started seriously investing in the last decade. With the market at this low point, we’re reminded of Warren Buffet’s famous line, “Be greedy when others are fearful and fearful when others are greedy”. The market has re-priced. It has presented an opportunity for long-term investors. Sentiment today is where it has historically stood during periods of market recessions. During this time, our best advice is to remain patient, stay as diversified as possible, and keep focused on consistently investing towards your goals.
Follow our Instagram for personal finance tips and inspiration.
Stephanie Bucko and Cristina Livadary are fee-only financial planners based in Los Angeles, California. Stephanie is the Chief Investment Officer and Cristina is the Chief Executive Officer at Mana Financial Life Design (FLD). Mana FLD provides comprehensive financial planning and investment management services to help clients grow and protect their wealth throughout life’s journey. Mana FLD specializes in advising ambitious professionals who seek financial knowledge and want to implement creative budgeting, savings, proactive planning and powerful investment strategies. As fee-only fiduciaries and independent financial advisors, Stephanie and Cristina never receive commission of any kind. Stephanie and Cristina are legally bound by their certifications to provide unbiased and trustworthy financial advice.