
Mana’s 2022 Investment Review and Market Outlook
Over the full year of 2021, commodities returned 40.4% and US Real Estate added 38.7%. US Growth and US Value have traded places regularly over the trailing 1, 3, and 6-month periods as Value jockeys to more permanently de-throne Growth stocks. US Treasuries, Emerging Market Equities, and Aggregate Bonds were the only negative-performing asset classes over the last year. Q4 marked the first quarter of 2021 in which Commodities, which rose just 1.5%, did not outperform all other asset classes. Instead, US Real Estate's 14.6% growth in the 4th quarter topped US Growth Stocks & the S&P 500. Emerging Markets posted a second consecutive down quarter for the first time since 2018.

Extensive research has shown that, if you have a diversified portfolio, a whopping 88% of your experience (the volatility you encounter and the returns you earn) can be traced back to your asset allocation. - Vanguard
Investment Commentary + Outlook
A year in review
If there was one word I’d use to define the financial markets in 2021 it would be inflation. You likely noticed that everything got a little more expensive last year. Whether you were buying or renovating a home, putting gas in your car, buying groceries, or even investing in NFTs, prices went up. If you didn’t know what inflation was before 2021, we’re sure you do now. For a while now, most places in the world hadn’t seen inflation so prevalent. Over the last 40 years, globalization and technological innovation have been key factors keeping prices relatively stable. How did this work? When the world comes together to produce goods and services, labor costs go down. Similarly, when technology is leveraged to deliver goods and services, the input costs go down. As a result, this combination kept prices from increasing too significantly, and companies with the ability to leverage globalization, technology, and scale have recently been able to succeed (think Amazon).
But in 2021, things were different. The COVID crisis created an environment that disrupted supply chains due to employees being out of work or businesses being restricted from operating, while also disrupting demand because people were forced to stay at home versus going out and spending money. As immunity developed in early 2021 from vaccinations and exposure to the virus, the wider population adapted to living more normally, despite the emergence of the Delta and Omicron variants. This acceleration resulted in a sharp reduction in unemployment, and a surge in demand beyond what supply could handle, driving inflation to the highest levels in the past 40 years. While inflation is negatively impactful to your purchasing power, it can be accretive for financial assets. For example, in 2021, commodities rose by 40.4% and real estate by 38.7% (Commodities are represented by the S&P GSCI Total Return Index, and Real Estate by Dow Jones US Real Estate Total Return Index. Please note that you may not invest directly into an index, and that past returns are no guarantee of future results).
Inflation-related assets were not the only to rise in 2021. Global developed market stocks also appreciated, providing double digit returns, far exceeding our long-term expectations of 4-6%. The S&P 500 index total return was 28.7% and MSCI World Ex USA total return was 13.2% (Please note that you may not invest directly into an index, and that past returns are no guarantee of future results). Economies around the world were provided stimuli in this crisis, but the US outperformance, we believe, was driven by the tremendous fiscal stimulus into US households and businesses. Legislators passed an unprecedented $5.3 trillion stimulus to the economy. To put this into perspective, the economic relief provided as part of the Great Recession in 2008/2009 was $1.8 trillion over 5 years, whereas the majority of this package was provided within the first 6 months. This swift and large stimulus provided businesses and individuals with extra savings, and combined with low interest rates and a surging demand, resulted in companies growing beyond expectations and stock prices rising.
The Federal Reserve (“the Fed”) continues to have accommodative monetary policies: they are buying financial assets, and keeping interest rates low. This has been good for financial markets, enabling low-cost lending, but both the government and corporations are carrying a large debt burden. The Fed has come forth to indicate their desire to slow asset purchases and increase target rates this year, but it’s a delicate balance. The Fed’s priorities are to achieve maximum employment and to have inflation (it’s the sign of a healthy economy), but not too much inflation. Although unemployment is improving, and from a percentage basis appears in solid shape, the number of available jobs has drastically decreased since the start of the pandemic. Wages are rising, which has helped with labor demand, and rising wages will typically help to fuel persistent inflation. Our hope is the Fed is able to navigate appropriate rate rises that satisfy the need to maintain inflation, but remain tempered in their approach. Fortunately this Fed has been very communicative in their intended actions and the factors they are monitoring, which gives us comfort that a dramatic rate rise will not be in the cards for 2022. Historically, stocks have performed well during rate rises when rates are under 5%, except during the 1994/95 period where changes to monetary policy were a surprise and drastic.
Growth vs Value
Over the last decade, it’s been great to be an investor in growth stocks. Over the past 10 years (through December 31, 2021) growth stocks, measured by Russell 1000 Growth Total Return Index, have grown by 19.8% per year on average (Please note that you may not invest directly into an index, and that past returns are no guarantee of future results). Returns were particularly strong in mega-cap growth companies, who leveraged size, scale, globalization, and technological development to produce tremendous returns for investors. “Past performance is no guarantee of future results” is a phrase you’ll hear a lot in the financial world, but it’s because this holds true in so many cases. The Wall Street Journal writes: It may be difficult to imagine a company as dominant as Apple stumbling, but that has always been the case with past market champions. The top stocks in the index 10, 20 and 40 years ago were Exxon Mobil, General Electric and AT&T, respectively. Only Exxon Mobil continues in recognizable form today. And while returns are strong to earn companies the top seat in terms of market capitalization, after they reach the top 10, history has shown that they tend to underperform the broader market.

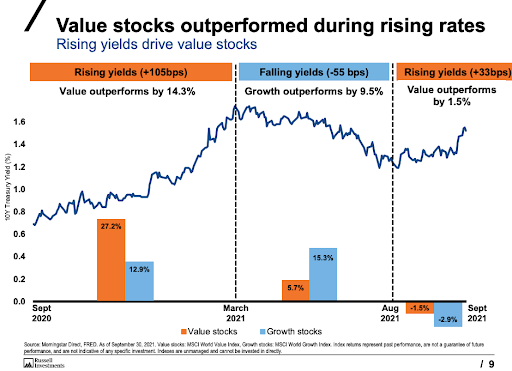
As we closed 2021 and entered 2022, we saw a sector rotation of which stocks are performing best. We were alarmed by this statistic in particular (from October 2021): Hedge fund manager Doug Kass stated: “over the last 9 months, Elon Musk has increased his wealth more than Warren Buffet has in the last 91 years.” Furthermore, during historic rising rate environments, value stocks have outperformed.
Year-to-date, we have seen the impact of high valuations unwinding with the potential of the Fed increasing the target rates. WisdomTree shows in the chart below how various factors have performed year-to-date through January 26, 2022. Growth stocks dropped -13.5% on average, while value only dropped -4.5%.

Investing Abroad
A core component of our investing style at Mana is that we want to invest in global growth, with the composition of our portfolios representing the global market capitalization. While international stocks lagged the US stock market in 2021, they still produced double digit returns, with the MSCI ex-USA World Total Return Index up 13.2%.
The US has appreciated from the tailwinds of a tremendous amount of fiscal support, but the result has been higher valuations in the US stock market. Accordingly to JP Morgan, as of December 31, 2021, the forward price to earnings ratio of the S&P 500, which is calculated by dividing the consensus analyst estimates of earnings per share for the next 12 months into the price of each stock was 21.18x compared to the 25-year average of 16.83x. We see even higher valuation extremes when looking at metrics including Shiller’s CAPE Ratio, Price to Book Ratio, and Price to Cash Flow Ratio.
Based on current valuations, international stocks are historically cheap, reaching the largest discount to US stocks over the past 15 years. The average discount is -30%, compared to an average of -12.4% over the past 15 years.

Regime shifts can be significant, and can persist for longer time frames. We define a regime change when there is sustained outperformance of one region over the other for a cumulative 12 months. Since 1970, there have been five periods where MSCI EAFE outperformed MSCI USA with that outperformance lasting 3.8 years on average.
Emerging market economies did not experience the same euphoric stock returns as we saw in developed markets. A combination of inflation, commodity prices, and threats of Chinese corporate regulation resulted in a negative year for emerging markets. The MSCI EM Index lost 2.54%. The market reaction was either to sell or hold. As long term investors, we understand that volatility is part of investing in this asset class.
The Bond Market
In 2021 US bonds delivered their 3rd worst return since 1976. Not all bonds are created equal, however, and it’s important to note that municipal bonds were positive in 2021 despite rising rates. An added perk to investing in municipal bonds is that it gives you exposure to the infrastructure investing that the US is focused on improving (Source: Morningstar Direct. 70% IG & 30% HY Municipal Bond Portfolio- 70% Investment Grade(IG): Bloomberg Muni 1-15 Yr. Blend (1-17) Index and 30% High Yield(HY): Bloomberg HY Muni Index. Index returns represent past performance, are not a guarantee of future performance, and are not indicative of any specific investment. Indexes are unmanaged and cannot be invested in directly).

Impact Investing
We know it’s important investing money by supporting the world they want for future generations is important to many of our clients. Since 2020, we’ve incorporated impact investing into our portfolios by examining investments we want to hold through additional lenses. Our chosen impact portfolios aim to improve gender diversity in leadership, to divest from fossil fuels and reduce greenhouse gas emissions.
Despite outperformance of sustainable investments in 2020, and meta-studies finding positive correlations between ESG and financial performance, a study by the Institute for Sustainable Investing of Morgan Stanley shows that 70% of individual investors believe sustainable investing requires a financial tradeoff. Concern about returns remains the most highly cited barrier to sustainable investing.
These worries, however, did not stop the massive inflow into sustainable funds. In fact, sustainable funds attracted a record $69.2 billion in net flows in 2021, a 35% increase over the previous record set in 2020. And, contrary to the concerns cited by investors, in 2021, most sustainable funds delivered stronger total and risk-adjusted returns (measured by Sharpe ratio) than their respective Morningstar Category indexes.
Mana’s 2022 Market Outlook
While inflation was the key word for 2021, the first weeks of 2022 have brought back a term that might not be as familiar to those who only recently started investing: volatility. If you’ve been a client of ours for a while, you’ll remember that Cristina and I began our Wall Street careers (2006 for Cristina and 2008 for me) when volatility was a part of our everyday vocabulary. However, if you began investing in the last ten years, volatility might not be something you’re accustomed to. The chart below shows that significant corrections - to the tune of an approximate average of 14% a year - have been a regular occurrence since 1980. (Bloomberg, First Trust Advisors L.P. Past performance is no guarantee of future results. The benchmark used for the above chart is the S&P 500 Index. The S&P 500 Index is an unmanaged index of 500 stocks used to measure large-cap U.S. stock market performance. Investors cannot invest directly in an index. Index returns do not reflect any fees, expenses, or sales charges. Returns are based on price only and do not include dividends. This chart is for illustrative purposes only and not indicative of any actual investment. These returns were the result of certain market factors and events which may not be repeated in the future).
We at Mana view stock market corrections to be very healthy for long term investors. In exchange for volatility, investors have historically been rewarded with higher returns than bonds or cash. What does that equate to, numerically speaking?
From 1926 to 2021, the 96-Year average annual return of the S&P 500 is 10.5%
The S&P 500 has posted positive returns 74% of the time
The average positive return on the S&P from 1926-2021 was 21.3%

The question then becomes: if inflation persists, will it hurt stock returns? One thing we can do is look at historical data. Since 1992, one-year returns on US stocks have fluctuated widely. Yet weak returns occurred when inflation was low in some periods, and 23 of the past 30 years saw positive returns even after adjusting for the impact of inflation.

Annual inflation-adjusted returns of S&P 500 Index vs. inflation, 1992-2021.
Over the period charted, the S&P 500 posted an average annualized return of 8.1% after adjusting for inflation. Going all the way back to 1926, the annualized inflation-adjusted return on stocks was 7.3%. History shows that stocks tend to outpace inflation over the long term—a valuable reminder for investors concerned that today’s rising prices will make it harder to reach their financial goals.
Many of our clients have continued to purchase homes in this wild housing market. Although we don’t see any signs of the housing market slowing down, it’s worth mentioning that if you’re not in the market to buy a house in the near future, you may be better off sticking to long term investments in the capital markets. This chart shows the cumulative return of different asset classes following the S&P 500 Index market peak before the Financial Panic of 2008. Since 2007, stocks have averaged an annualized return of 10.6% while home prices have increased by an annual 3.5%. Homes do have the added benefit of income, and a friendly reminder that rental income is not passive income unless you pay to fully outsource the responsibility.

As we look to 2022, the core themes in our investment outlook are as follows:
Policy choices will be a major driver in investment returns. Because of the unpredictability in policy, we are taking a risk management approach when it comes to interest rate risk, and evaluating sizing in regions where policy risk is more volatile.
Productivity is improving as the pandemic fears fade, which has kept growth forecasts broadly stable for our long-term expectations. However, we are considering adding alternative asset classes to support portfolios in the scenario where inflationary pressures persist.
Concentration is dangerous in this market environment, particularly in sectors with high valuations. What’s worked in the past may not work in the future.
Long term, we believe that ESG investing, new asset markets, and disruptive forces like crypto are shaping the investment landscape.
With volatility on the rise, we continue to assert that time horizon is the most important factor to consider as we invest your hard earned money. Drawdowns are normal, but it’s important that these drawdowns aren’t occurring when you need your investments converted into cash. While bonds aren’t ideal in terms of the best returns for the current market environment, our goal in utilizing bonds is to provide diversification and stability to be able to draw upon.
Although the projected market volatility may intimidate some of you, remember that we at Mana will be keeping cool heads as we make our decisions this year. Remember to stay the course and reap the benefits of a well designed long-term plan. As always, we’re grateful for all of our clients and readers of the investment letter, and we look forward to chatting with any of you looking for additional thoughts or advice this year!
Follow our Instagram for personal finance tips and inspiration.
Stephanie Bucko and Cristina Livadary are fee-only financial planners based in Los Angeles, California. Stephanie is the Chief Investment Officer and Cristina is the Chief Executive Officer at Mana Financial Life Design (FLD). Mana FLD provides comprehensive financial planning and investment management services to help clients grow and protect their wealth throughout life’s journey. Mana FLD specializes in advising ambitious professionals who seek financial knowledge and want to implement creative budgeting, savings, proactive planning and powerful investment strategies. As fee-only fiduciaries and independent financial advisors, Stephanie and Cristina never receive commission of any kind. Stephanie and Cristina are legally bound by their certifications to provide unbiased and trustworthy financial advice.