
Third Quarter Market Commentary 2021
Today’s blog post is a recap of our quarterly investment letter. Here are our thoughts…
Asset Class Performance
The US stock market was relatively flat in the 3rd quarter of 2021, with the S&P 500 slightly positive and the Nasdaq Composite and Dow Jones slightly negative for the quarter. The story was a bit different internationally, with the MSCI Emerging Markets index taking the largest hit, selling off nearly 8% in Q3 after many countries overseas had headline news. Sector performance in Q3 looked a lot different than Q2. While the 2nd quarter brought positive returns in all but one sector, Q3 has presented us with mixed returns. The Financial sector outperformed the rest while the Industrial sector lagged by -4.1% this quarter. With the markets retreating from all-time-highs towards the end of the quarter, the defensive sectors followed suit giving back most of the gains from the beginning of the quarter. This visual shows historical quarterly asset class performance for the last 15 quarters. Commodities continue to lead all asset classes in 2021. In addition, US Growth outpaced US Value for the second straight quarter, and US Large Caps (S&P 500) led US Small caps. Lastly, emerging markets had its first negative quarter since Q1 2020.

Source: YCharts. Asset classes are represented by the following indices. Note you are not able to invest directly in an index. US Real Estate = Dow Jones US Real Estate Index Total Return, US Growth Stocks = Russell 1000 Growth Total Return, Commodities = S&P GSCI Total Return, US Small Cap = Russell 2000 Total Return, S&P 500 = S&P 500 Total Return, US Value Stocks = Russell 1000 Value Total Return, World ex USA = MSCI World Ex USA Total Return, Emerging Markets = MSCI Emerging Markets Total Return, Aggregate Bonds = Barclays US Aggregate Total Return, Muni Bonds = Barclays Municipal Bond Total Return, US Treasuries = Barclays US Treasury Total Return. Past performance is no guarantee of future results.
Investment Commentary + Outlook
On March 16, 2020, we were in the heat of a new global financial crisis. The market was adapting to daily newsflow and the Federal Reserve made an emergency rate cut. While we didn’t know how the months ahead would unfold, we knew much of it would depend on the severity of the virus, the extent of the shutdown, the impact on businesses, and actions taken by central banks around the world. Since that day in March, the global stock market index (MSCI World) increased by 80%, with small companies in the US (Russell 2000) leading the pack at a 116% return. Now the question is: can this continue?
Earnings will be important in the next 12-18 months. Corporate expectations have been muted, citing supply chain issues and a shortage in the labor market. Corporate costs are rising in two ways: input costs and labor costs. Over the short run, supply constraints will put pressure on the costs of materials and goods, but there should be balance on overall costs with the continued integration of technology into business models. If we do see revenues hold stable and costs rise, businesses could experience margin compression. More likely, with rising wages and a resurging demand, corporations will be able to pass along the increase in costs to their consumers who are now increasingly more financially healthy. In short, there will be winners and losers, but the whole pie gets bigger.
We continue to believe in our economies and markets growing, despite headwinds to investors including less friendly monetary, fiscal, and tax policies, along with rising inflation.
Our main takeaway from the high growth that we’ve experienced over the last 18 months is that not all sectors of the market are equal. We talk more about value versus growth on our next page, but to illustrate the divergence in valuations between value and growth stocks outside of quoting valuation metrics, we think this point is best explained by this jaw dropping statistic from hedge fund manager Doug Kass: over the last 9 months, Elon Musk has increased his wealth more than Warren Buffet has in the last 91 years.
Value versus growth: defined
Growth = companies who are expected to grow at an above-average rate. Think Amazon, Tesla, Netflix.
Value = low price-to-book values and low price-to-earnings ratios. Think JP Morgan, Berkshire Hathaway, Johnson & Johnson.
What’s the price of the stock market?
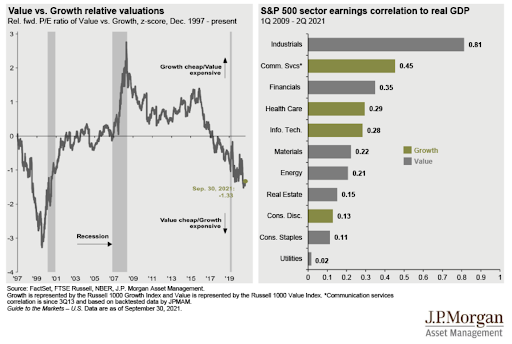
The price to earnings ratio is a fundamental indicator of the stock market, measured by the price of the stock divided by the company’s earnings per share. While high valuations have not been a strong predictor of a market crash, low valuations have indicated a good time to buy. This chart from JP Morgan’s Guide to the Market shows the relative valuation of value stocks (represented by Russell 1000 value index) versus growth stocks (represented by Russell 1000 growth index). The last time we reached these levels was months before the tech bubble crashed. We don’t believe we are in a tech bubble - technology stocks today have real products and real earnings - however, value stocks are cheap by comparison to history.

How do stocks perform when rates rise?
As we prepare for the Federal Reserve to hike interest rates over the coming years, it’s important for us to understand how increases to interest rates impact the stock market. According to studies done by JP Morgan, on average over past rate hike cycles, the stock market has performed well when interest rates are below 5%. Furthermore, as seen on the chart on the left, Russell Investments has found that rising interest rates drive value stocks to outperform.
As always, we recommend speaking with your investment manager to learn more about what your best plan of action should be at this time.
Stephanie Bucko and Cristina Livadary are fee-only financial planners based in Los Angeles, California. Stephanie is the Chief Investment Officer and Cristina is the Chief Executive Officer at Mana Financial Life Design (FLD). Mana FLD provides comprehensive financial planning and investment management services to help clients grow and protect their wealth throughout life’s journey. Mana FLD specializes in advising ambitious professionals who seek financial knowledge and want to implement creative budgeting, savings, proactive planning and powerful investment strategies. As fee-only fiduciaries and independent financial advisors, Stephanie and Cristina never receive commission of any kind. Stephanie and Cristina are legally bound by their certifications to provide unbiased and trustworthy financial advice.